Because the clinical effects are general and can be mistaken for other illnesses it is extremely importantthat individuals
Do not share needles
Have one monogamous sexual relationship with a faithful uninfected partner
Regularly use condoms when having relations with multiple partners
Learn how to use a condom properly
Get regular screenings for HIV
Note: Many individuals are unaware that they are infected because they do not exhibit symptoms. Even though they are not displaying symptoms they can still infect others.
HIV life cycle The video below shows the life cycle of HIV
Symptoms may appear in cycles and may come and go at different intensities and for different lengths of time. But, especially at the beginning of the illness, the symptoms may not follow this typical pattern. Source
Malaria life cycle further explained
Malaria song and an opportunity to donate towards malaria relief and receive a cool t-shirt
Evidence that global warming has NOT been altered by human activities
1. Anglia global warming
Emails hacked from scientists of the Hadley Climatic Research Unit at Britains University of East Anglia suggest questionable methods of how data analyzing human induced global warming have been recorded and interpreted. Emails show that researchers have debated deleting information requested by critics. They also discussed removing posts from publications where critics' papers were published. What does this mean and why should you care? Science should be evidence based and when data is analyzed by another party they should get the same results as the previous party. The scientists considerations regarding deleting information raises concerns of the accuracy of the data that was collected. Did they ignore data that did not support their claims and are afraid that they will be found out? Why the secrecy and thoughts of removing posts if their claims are accurate, honest, complete and science based? On the other hand were these emails forged or altered? The best way to settle the dispute of the accuracy of these results would be to redo the calculations by several groups of unrelated scientific parties and see if they get the same results. Until then the results produced by these scientists may be biased.
2. Solar flare activity The graph below shows that there is no relation between an increase in carbon dioxide and increase temperatures. However, the increase has a relation with solar activity. As solar activity increases temperature increases as emitted radiation from the sun increases. Therefore increased temperatures is not a result of an increase in carbon due to human activities but to excess radiation from increased solar flares.
3. Medieval Global Temperature Optimum
Between the 10th and 14th centuries summer temperatures were between 1 and 1.4 degrees higher than they are now in the 20th century. This change was caused by a change in air circulation over the Atlantic. In the 10th and 14th century their were less automobiles than they are now and less air pollution caused by the release of carbon from exhaust. If temperatures were hotter then before humans really began burning fossil fuels then hotter temperatures may just be a normal occurrence.
4. Little Ice Age
The Little Ice Age occurred between 1300 and 1400. The temperature was 1.5 degrees Celsius lower than previous years and great seasonal variation was exhibited. Again this time period occurred before humans began burning fossil fuels and "drastically began altering the Earth". These changes are becoming apparent again as we have experienced colder and longer winters along with hotter summers and seasonal variations. Again the effects of global warming can just be natural occurrences that happens approximately every couple hundred years then reverts back.
A majority of the fresh water can be found in ice sheets, glaciers, and permafrost. It can also be found in ground and surface water. Lesser amounts can be found in the atmosphere.
Accessible water:
Only 1% of all water on Earth is usable. Usable water is most accessible from lakes and rivers. It can also be obtained from ground water, but ground water can be more difficult to get to in most cases. Unusable water can be typically found locked away in the glaciers and ice caps of Antarctica and Greenland.
Potable water: Potable water (drinking water) is water that does not contain diseases or heavy metals and is safe for consumption. Access to potable water is a major problem for some under developed countries. Unlike the United States many underdeveloped countries do not have the luxury of turning on a kitchen faucet to obtain this vital resource. Access to potable water can also be a problem for developed countries after a natural disaster where it can become contaminated through waste or exposure therefore making it undrinkable. Potable water originates from either surface or ground water.
In the United States potable water is first treated by a water treatment facility before it is transported to homes, schools, and businesses via pipes. In some Caribbean islands rain water is stored using personal cisterns and is then transported to the home without going through a water treatment facility. Bottled water also originates from surface or ground water. The different tastes associated with different brands of bottled water is based on the origin of the water and the method of treatment for example ozonated surface water (Aquafina) versus non ozonated spring water (Deer park).
The map above shows the scarcity of water throughout the world. southwest USA, north Africa, southeast Australia, and southeast Asia have experienced physical water scarcity. Central Africa has experienced economic water scarcity (2006)
Contaminated water also originates from surface or ground water. Water becomes contaminated through the introduction of microbial pathogens, organics, inorganics, and radioactive elements. Microbial pathogens include bacteria, viruses, and parasites. Inorganics include toxic metals like arsenic, barium, chromium, lead, mercury, and silver. Organics include pesticides, volatile organic chemicals (ex. degreasers, solvents), and trihalomthanes while radioactive elements include decaying uranium in soil.
Health effects associated with drinking contaminated water can be immediate or chronic and can result in temporary illness or death based on the type of contamination and the amount of water consumed. Based on the type of contamination water can be become potable through boiling, aeration, sunlight, micro organisms or other treatment methods. The best way to ensure that drinking water remains uncontaminated includes regular testing for contaminants, and physical observation.
The map shows an example of contamination caused by toxic metals and other toxic materials. Out of the four types of contamination stated above what kind of contamination is this?
If you stated inorganic contamination you are correct :)
2) Where in the world are the good and accessible soils for agriculture, silviculture, and farming?
Agriculture:
Arable soil is good soil for agriculture. When afforested, arable soil is high in nutrients, high in organic matter, high in pH and low in air- filled porosity. According to the US Bureau of reclamation land classification system it meets certain requirements. Arable land per population is mostly found in Oceania followed by North America and Europe. It is less found in Asia. Loam, peat, and muck are also good agricultural soils.
The maps above show the distribution of grain, oilseeds, and cotton crops throughout the world
http://www.pecad.fas.usda.gov/ogamaps/
Silviculture: Silviculture is the growing and cultivation of trees andPodsol (podzol) soil is the best type of soil for this environment. Podsol is a form of acidic soil with which organic matter and minerals are leached from the top light colored layer to the darker lower layer. This soil contains little organic matter and water does not flow. Podsol can be mostly found in the sub arctic, northen parts of humid continental climates, cooler parts of the marine west coast climates, and areas of high rainfall. This climate includes parts of Canada, 13% of New Zealand and parts of the Amazon basin.
This map states the distribution of Podzol in Canada
Dark nutrient rich soil is the best soil for farming. These nutrients include potassium, nitrogen and phosphorous. Fertilizer and manure adds these nutrients to the soil. Other soil requirements for farming depends on the type of crop since different types of crop will have different needs. Pore space, microbial, and tillage management are other things to consider when choosing farming soil.
The maps above show the distribution of pastures and crops though out the world.
3) Where in the world is traditional industry? Where in the world is the high-tech industry?
Traditional industry:
Traditional industries are industries that have experienced little change over time, are the backbone of that region, and are key to that regions economical success . For example Georgia's traditional industries include pulp and paper, food processing, and textiles and carpets. Therefore if these economies collapse Georgia will experience great economical loss. In Rome traditional industries include machinery, chemicals, iron and steel, textile and food processing.
The map above is an example of tradition industry. It shows the top ten walnut producing countries in the world
High technical industries are highly dependent on science and technology which would lead to new or improved products and services. They have large economical impact and are fueled by research, higher than average sales growth, and new development. They usually produce advanced technology products such as electronics including computers, telecommunications, aerospace and military equipment.
The map above is an example of global high -tech industry. It shows the distribution of the computer and official equipment industry which includes Japan and parts of North America
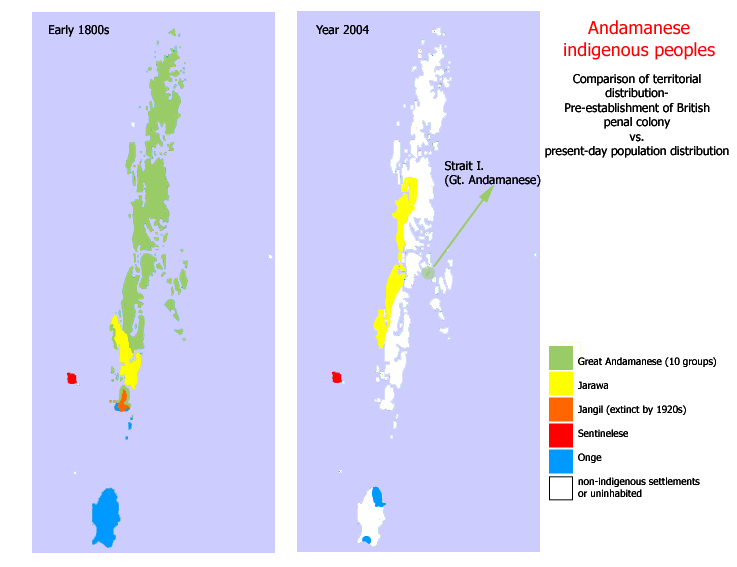
4) Identify the ten most populated cities in the world. Identify the ten most populated cities in the United States. Identify tribal groups in the world that have little or no contact with "modern society". Where is the greatest ethnic diversity? Where is the least ethnic diversity?
Tribal groups with little to no contact with modern society:
The Andamanese negrito-
They are located in the Andaman archipelago. Due to their location they are Indian citizens under the Indian union even though they may be unaware of it. The Great Andamanese, Onje, Jarawa, and Sentineli make up the four main groups.
This group first came in contact with the British in 1858. They are made up of 10 tribes and have a population of approximately 3,500 people. They reside in the Great Andaman islands. They now live on a reservation on Straits island and have a population of about 30 individuals
The Onge-
They reside on Little Andaman and lived in peace until after the Indian Independence of 1947. They have a low birth rate and had a population of about 700 in 1858
The Jarawa-
This tribe was known as being hostile and unfriendly until October 1997. They remained undisturbed until the late 1960's when a road was built through their jungle. Indian settlers attempted to recruit the Jarawa as unskilled labor in field and plantations, but they refused and have remained faithful to their old way of life. They have remained non hostile but continue to live distant to the surrounding Indian population.
The Sentineli -
They live on north Sentinel island and have a population of about 100. They are one of the worlds most isolated and least known people mainly because they remain distant from modern civilization. When friendship visits were attempted the tribe threw coconuts at the boats. They have also been known to use bows and arrows against passing helicopters.
Senteli warrior shooting an arrow after a helicopter
I had trouble locating this answer. My best guess would have been North America or Asia. North America because many individuals of diverse backgrounds migrated there to begin a new life. I would have also guessed Asia because it includes Russia, China, India, Mongolia, the Middle East, Indonesia etc. However, in the article below Tanzania tops the list with having 23 ethnic groups.
I also had trouble locating this answer. My best guess would have been Japan or China, but according to the article below it would be Papua New Guinea.
5) Where in the world are the people? What are some interesting statistics about the quality of life for the people of the world? (For example, how many large populations live great distances from clean water?
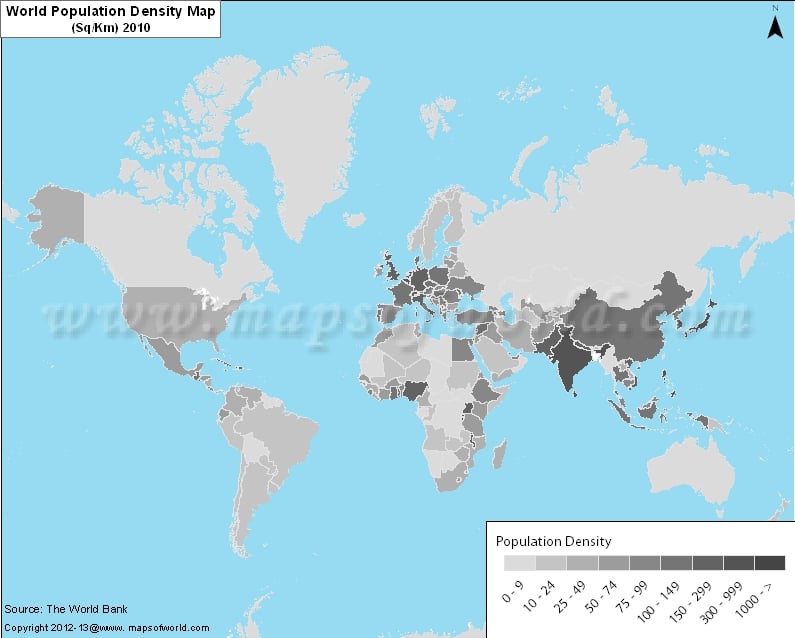
Distribution of people:
India has the highest population density followed by Japan, China, Egypt, Ethiopia, Morocco, Tunisia, Europe, USA, Central America, and the Caribbean.
Based on the maps below above it appears as if the distribution is based on a combination of access to water, access to ports, wealth and climate. It suggests that people tend to reside in wealthier countries close to major ports with warm climates and little water scarcity.Only 62% of the world’s population has access to improved sanitation.People living in the slums often pay 5-10 times more per liter of water than wealthy people living in the same city. A bathtub holds 151 L of water. A person living in a slum may only receive 30 L for all their daily needs. The above statistics show that wealth and access to water are vital resources. It suggests that poor people may have less access to clean water and would therefore experience a lower quality of life.